Excel worksheets combination
new header
new 2nd header
new level
What if our Client provides us with a number of poorly recorded databases with thousands of records in different Excel formats? not only that, within each Excel file, there are hundreds of worksheets with in-homogeneous structures –F.. Excel ^_^, but that is the reality, particularly when we have to work with Clients whose business are not much involved with TECH.
What if our Client provides us with a number of poorly recorded databases with thousands of records in different Excel formats? not only that, within each Excel file, there are hundreds of worksheets with in-homogeneous structures –F…. Excel ^_^, but that is the reality, particularly when we have to work with Clients whose business are not much involved with TECH.
Let start with time series data that is saved in hundreds of excel worksheets, examples are
- Production and consumption data of a single day. Within a day, volumes of production and consumption (e.g. water and energy of a water treatment plant or pump station, number of X and Y produced within a single hours);
- Hydrology data such as rainfall and runoff and other associated parameters etc
Ideally, those data should be recorded using relational database structured system such as MySQL or PostgreSQL. However, by default in many organizations, data is recorded in excel file. Everyday, owner of the file just multiply/copy the same worksheet of previous day and repeat the same work. This is OK for him/her but definitely not OK for us, the analyst :).
This post describes a step by step instruction on how to deal with this issue.
Examples
Data
Example data is with two excel files name data1 and data2. These two files have their structure identical as shown in the followings
data1
worksheet1
date    from    to  total_pro_hour  total_power_hour    ratio
01-Jan-17   12:00 AM1:00 AM        0.7700000    95   123.38
01-Jan-17   1:00 AM 2:00 AM        0.7400000    86   116.22
01-Jan-17   2:00 AM 3:00 AM        0.6200000    73   117.74
01-Jan-17   3:00 AM 4:00 AM        0.6100000    70   114.75
01-Jan-17   4:00 AM 5:00 AM        0.5700000    62   108.77
01-Jan-17   5:00 AM 6:00 AM        0.7300000    86   117.81
01-Jan-17   6:00 AM 7:00 AM        0.6900000    70   101.45
01-Jan-17   7:00 AM 8:00 AM        1.0100000    93   92.08
01-Jan-17   8:00 AM 9:00 AM        0.9100000    116  127.47
01-Jan-17   9:00 AM 10:00AM        1.0800000    120  111.11
01-Jan-17   10:00 AM 11:00AM       1.0900000    122  111.93
01-Jan-17   11:00 AM 12:00PM       1.0800000    119  110.19
01-Jan-17   12:00 PM 1:00PM        1.1000000    117  106.36
01-Jan-17   1:00 PM 2:00 PM        1.5420000    145  94.03
01-Jan-17   2:00 PM 3:00 PM        0.9330000    136  145.77
01-Jan-17   3:00 PM 4:00 PM        1.0520000    137  130.23
01-Jan-17   4:00 PM 5:00 PM        0.9600000    153  159.38
01-Jan-17   5:00 PM 6:00 PM        0.9910000    135  136.23
01-Jan-17   6:00 PM 7:00 PM        1.0110000    146  144.41
01-Jan-17   7:00 PM 8:00 PM        0.9320000    134  143.78
01-Jan-17   8:00 PM 9:00 PM        0.9680000    133  137.40
01-Jan-17   9:00 PM 10:00 PM       0.7110000    124  174.40
01-Jan-17   10:00 PM 11:00 PM   0.7800000   72   92.31
01-Jan-17   11:00 PM 12:00 AM   0.6100000   75   122.95

worksheet 2
02-Jan-17   12:00 AM 1:00 AM    0.5600000   48   85.71
02-Jan-17   1:00 AM  2:00 AM    0.4420000   42   95.02
02-Jan-17   2:00 AM  3:00 AM    0.4700000   40   85.11
02-Jan-17   3:00 AM  4:00 AM    0.6980000   59   84.53
02-Jan-17   4:00 AM  5:00 AM    0.8200000   86   104.88
02-Jan-17   5:00 AM  6:00 AM    0.4700000   48   102.13
02-Jan-17   6:00 AM  7:00 AM    1.0400000   121  116.35
02-Jan-17   7:00 AM  8:00 AM    1.0800000   146  135.19
02-Jan-17   8:00 AM  9:00 AM    1.0800000   122  112.96
02-Jan-17   9:00 AM  10:00 AM   0.9600000   82   85.42
02-Jan-17   10:00 AM 11:00 AM   0.9100000   73   80.22
02-Jan-17   11:00 AM 12:00 PM   0.8500000   65   76.47
02-Jan-17   12:00 PM 1:00 PM    0.7100000   57   80.28
02-Jan-17   1:00 PM  2:00 PM    0.9690000   48   49.54
02-Jan-17   2:00 PM  3:00 PM    0.8310000   65   78.22
02-Jan-17   3:00 PM  4:00 PM    1.1290000   96   85.03
02-Jan-17   4:00 PM  5:00 PM    1.2300000   109  88.62
02-Jan-17   5:00 PM  6:00 PM    1.1210000   114  101.69
02-Jan-17   6:00 PM  7:00 PM    0.9440000   110  116.53
02-Jan-17   7:00 PM  8:00 PM    0.9790000   112  114.40
02-Jan-17   8:00 PM  9:00 PM    1.0260000   108  105.26
02-Jan-17   9:00 PM 10:00 PM    0.8710000   118  135.48
02-Jan-17   10:00 PM 11:00 PM   0.8100000   99   122.22
02-Jan-17   11:00 PM 12:00 AM   0.6800000   79   116.18
This excel file contains 2 worksheet “1” and “2” that record hourly production (ML) and energy consumption (KW) of a water pump station.
- column is the date;
- column 2 and 3 are hours;
- column 4 is production data in million liter (ML);
- column 5 is energy consumption data in KW
- column 6 is ratio between energy consumption and production, basically it is the division of column 5 and 4.
This kind of data is recorded hourly and there will be about 30 worksheets for one month. Let say you have 5 or 10 years production data saving in excel files like this and you need to combine all of them into a single frame for Business Analysis purpose. It will be a nightmare if you just copy and paste 🙂 terrible excel.
Assumptions
It is assumed that all worksheets in all excel files are identical in their structure. This is not a realistic assumption as excel users cannot be consistent with their data. Data in their excel files are
Mixed up with numeric and text even for the same attributes; Merging cells, adding new rows and columns that make them homogeneous. Solving such problem is not the objective of this post, but it is worth to mention that before we get a good set of data, we probably need to do some Coding in Visual Basic to standardize the excel worksheets, or we need to do a certain level of manual data compiling before we can run the code in R.
Will cover how to standardize using the same sets of data in other post.
Combining worksheets using Navicat and MySQL
Why NAVICAT?
–> Navicat offers a handy way to import data from excel files. It can import multiple worksheets in one single click into respective tables of MySQL. I find this feature superior than other open source SQL Client such PhPmyAdmin, Dbeaver, etc.
Herein, I demonstrate some steps to import the example data files.
a. Create table
create
table
`1` (
date varchar(255),
`from` varchar(255),
`to` varchar(255),
total_pro_hour varchar(255),
total_power_hour varchar(255),
ratio varchar(255)
);

create table `2` as select * from `1`;
create table `3` as select * from `1`;
create table `4` as select * from `1`;
create table `5` as select * from `1`;
create table `6` as select * from `1`;
create table `7` as select * from `1`;
create table `8` as select * from `1`;
create table `9` as select * from `1`;
create table `10` as select * from `1`;
create table `11` as select * from `1`;
create table `12` as select * from `1`;
create table `13` as select * from `1`;
create table `14` as select * from `1`;
create table `15` as select * from `1`;
create table `16` as select * from `1`;
create table `17` as select * from `1`;
create table `18` as select * from `1`;
create table `19` as select * from `1`;
create table `20` as select * from `1`;
create table `21` as select * from `1`;
create table `22` as select * from `1`;
create table `23` as select * from `1`;
create table `24` as select * from `1`;
create table `25` as select * from `1`;
create table `26` as select * from `1`;
create table `27` as select * from `1`;
create table `28` as select * from `1`;
create table `29` as select * from `1`;
create table `30` as select * from `1`;
This SQL creates 30 tables name from 1 to 30 that correspond to each day in a month. Note that for February, there are 28 days but dont worry, we still use 30 or 31 worksheets as additional worksheets will be blank anyway and make no harm to the operation.
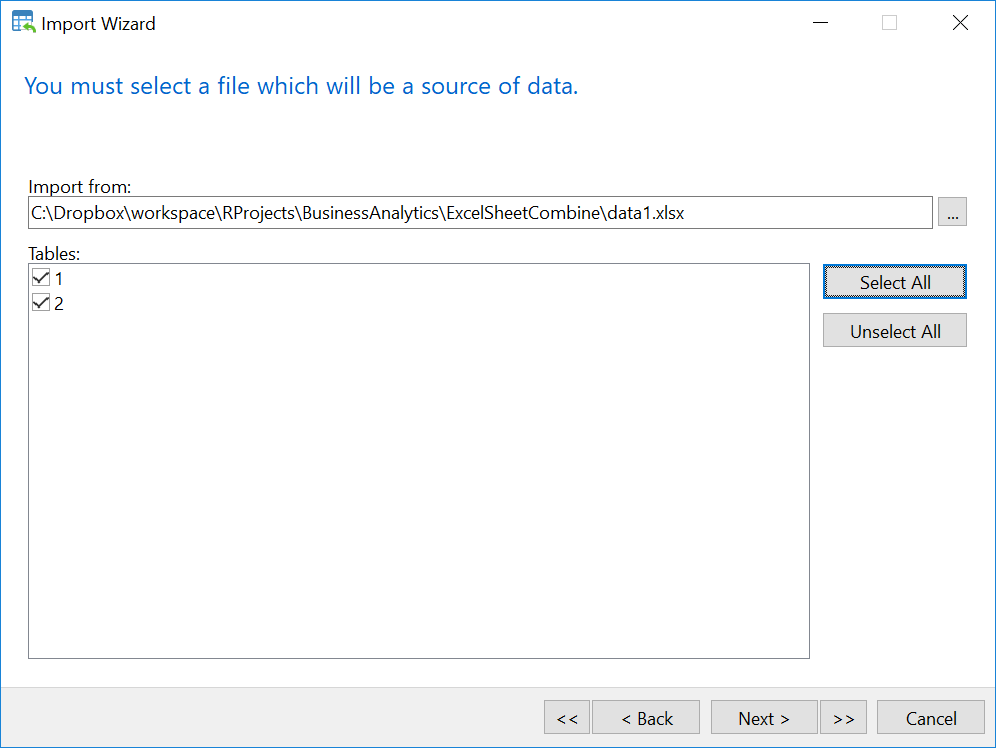
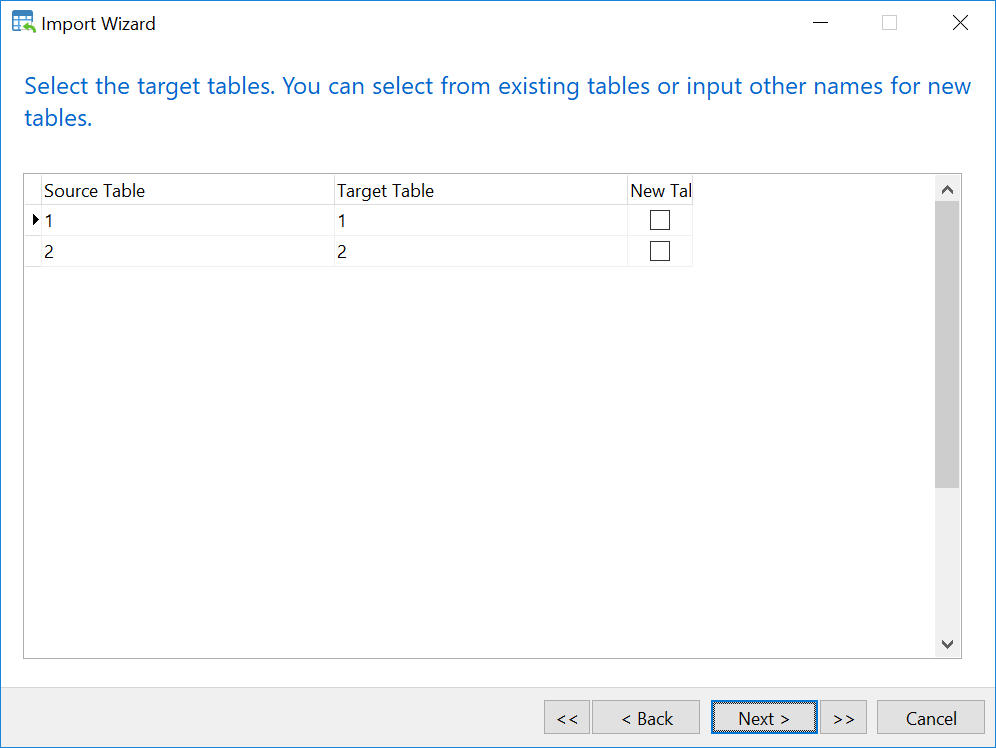
b. Manual importing worksheets from the excel file to MySQL table using NaviCAT
- Select table 1 in MySQL database
- Right Click –> Import Wizard
- Select Excel file and Click Next
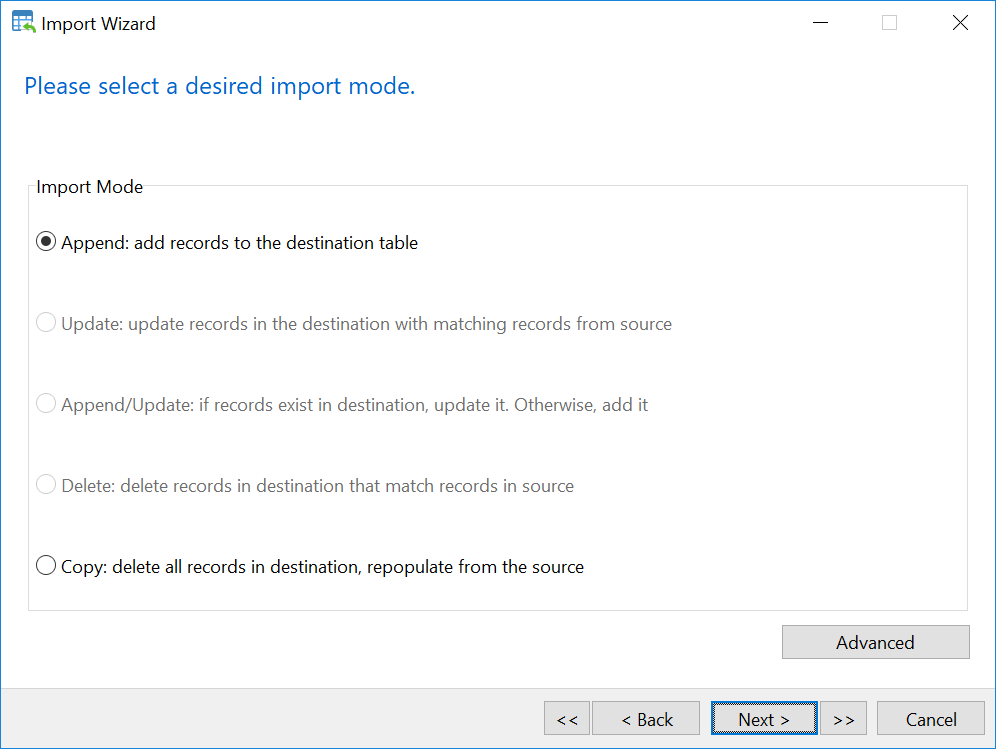
- Import the excel file
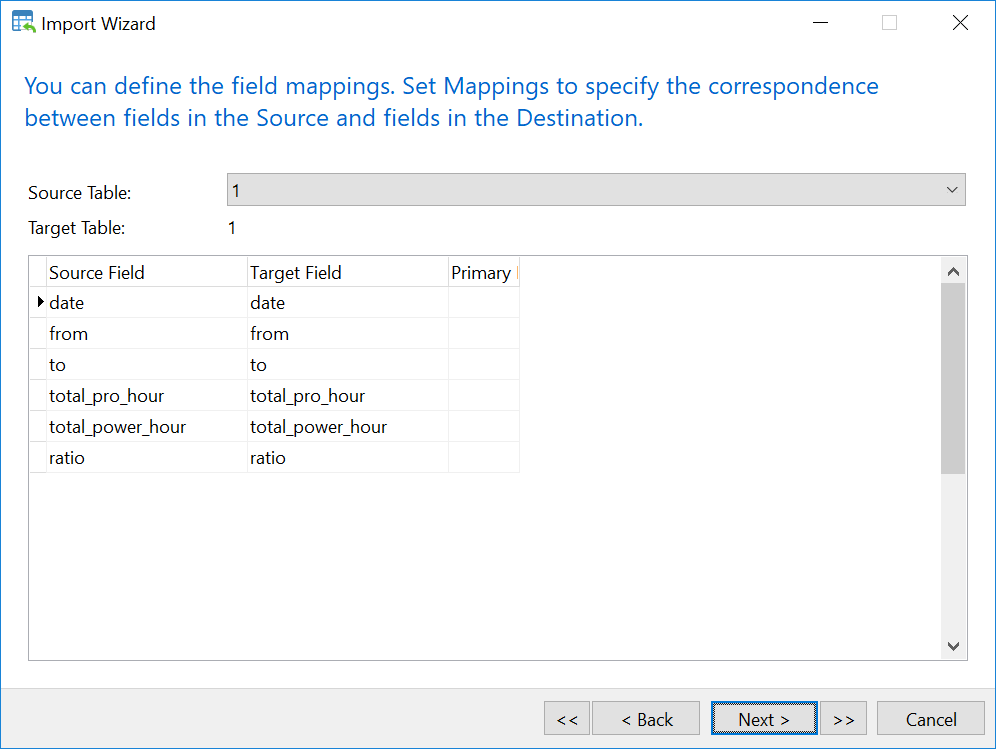
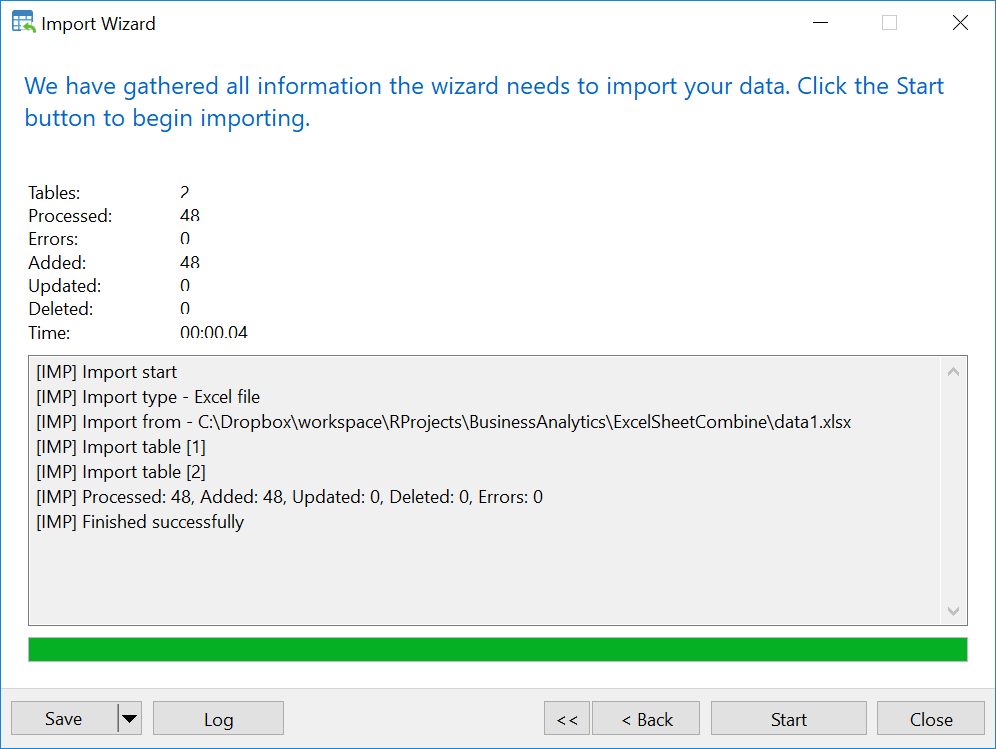
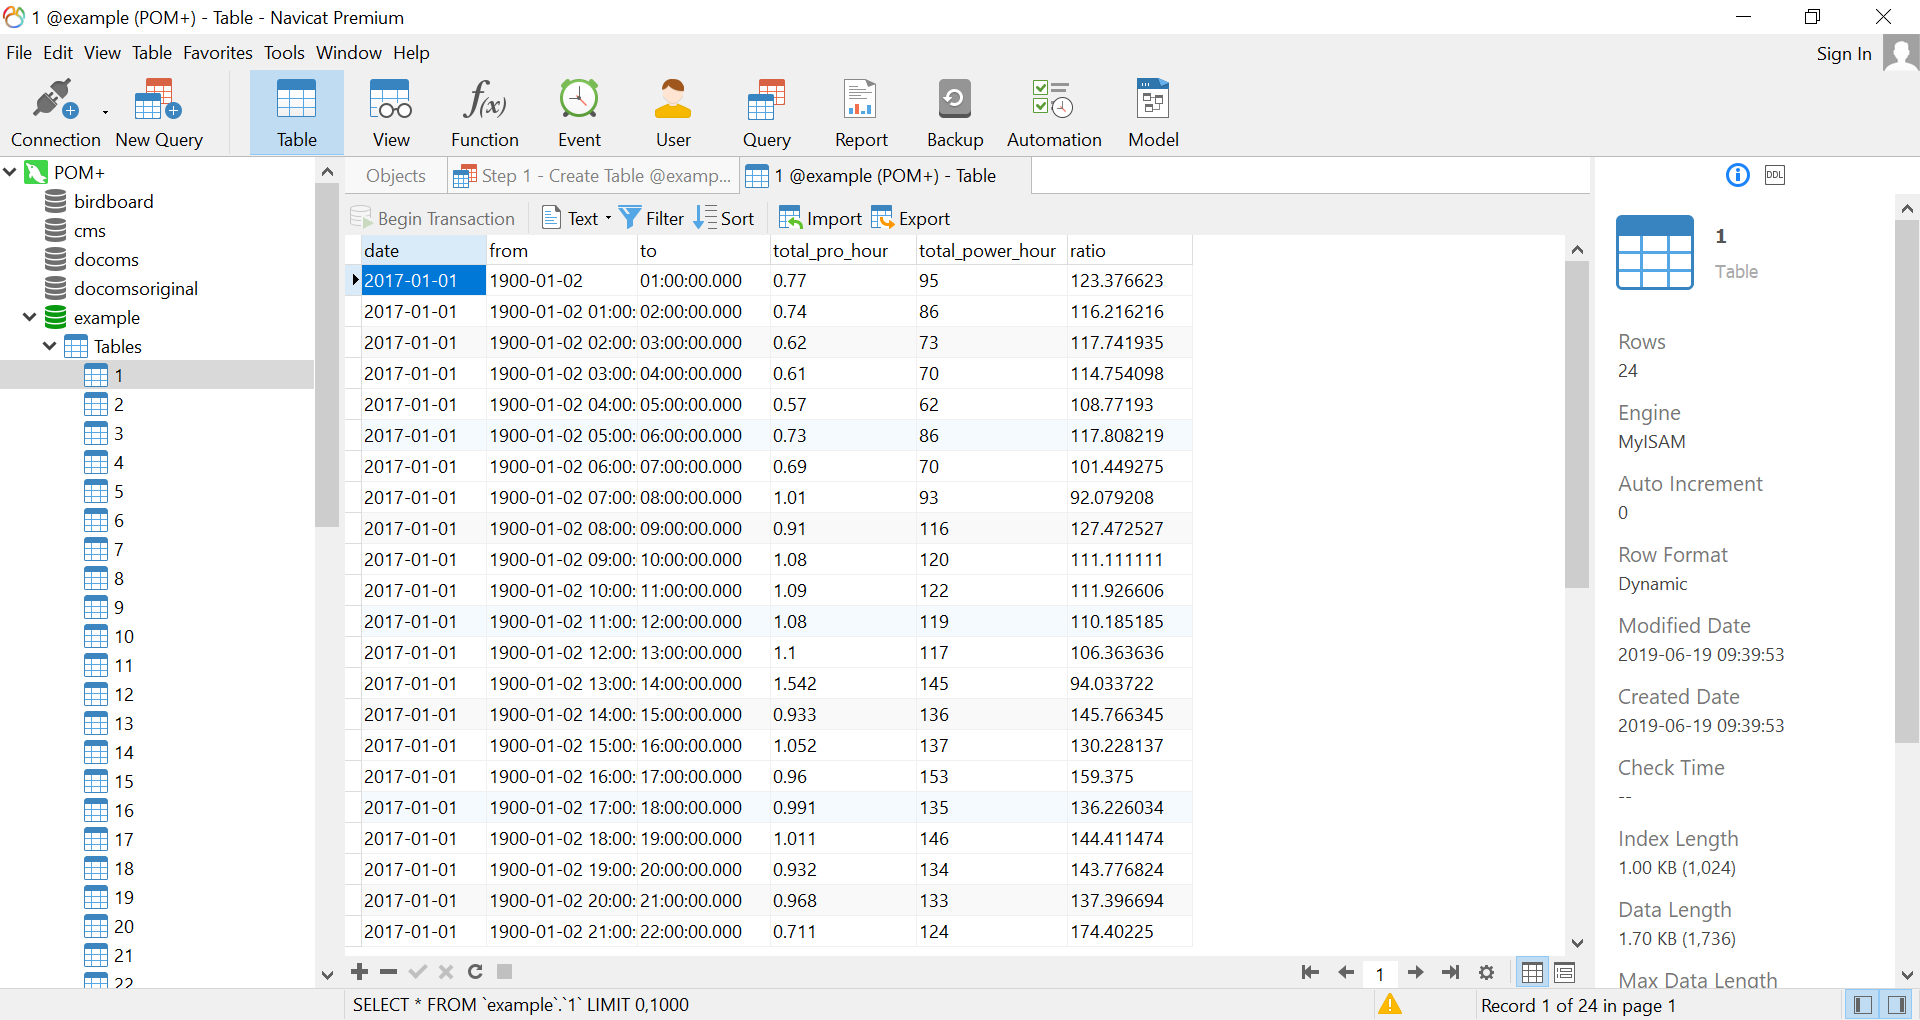
Now you have all tables you need in MySQL. However, Values of time shown in FROM and TO column have change from AM, PM to something else. For example 1900-01-02 should be 24. To solve this issue, we will use the following SQL syntax
c. Rename tables
RENAME TABLE
`1` TO pat_2018_10_1,
`2` TO pat_2018_10_2,
`3` TO pat_2018_10_3,
`4` TO pat_2018_10_4,
`5` TO pat_2018_10_5,
`6` TO pat_2018_10_6,
`7` TO pat_2018_10_7,
`8` TO pat_2018_10_8,
`9` TO pat_2018_10_9,
`10` TO pat_2018_10_10,
`11` TO pat_2018_10_11,
`12` TO pat_2018_10_12,
`13` TO pat_2018_10_13,
`14` TO pat_2018_10_14,
`15` TO pat_2018_10_15,
`16` TO pat_2018_10_16,
`17` TO pat_2018_10_17,
`18` TO pat_2018_10_18,
`19` TO pat_2018_10_19,
`20` TO pat_2018_10_20,
`21` TO pat_2018_10_21,
`22` TO pat_2018_10_22,
`23` TO pat_2018_10_23,
`24` TO pat_2018_10_24,
`25` TO pat_2018_10_25,
`26` TO pat_2018_10_26,
`27` TO pat_2018_10_27,
`28` TO pat_2018_10_28,
`29` TO pat_2018_10_29,
`30` TO pat_2018_10_30
;
Here we rename the table to whatever we need. By doing so, we can resue the Create Query to perform the same procedure for importing new table.
d. Create Production table
create
table
production (
date varchar(255),
`from` varchar(255),
`to` varchar(255),
total_pro_hour varchar(255),
total_power_hour varchar(255),
ratio varchar(255)
);
This code creates a production table.
e. Import/Append all raw tables into one table – Production
INSERT INTO production
SELECT *
FROM pat_2017_1_1;

INSERT INTO production
SELECT *
FROM pat_2017_1_2;

INSERT INTO production
SELECT *
FROM pat_2017_1_3;

INSERT INTO production
SELECT *
FROM pat_2017_1_4;

INSERT INTO production
SELECT *
FROM pat_2017_1_5;
INSERT INTO production
SELECT *
FROM pat_2017_1_6;
INSERT INTO production
SELECT *
FROM pat_2017_1_7;
INSERT INTO production
SELECT *
FROM pat_2017_1_8;
INSERT INTO production
SELECT *
FROM pat_2017_1_9;
INSERT INTO production
SELECT *
FROM pat_2017_1_10;
INSERT INTO production
SELECT *
FROM pat_2017_1_11;
INSERT INTO production
SELECT *
FROM pat_2017_1_12;
INSERT INTO production
SELECT *
FROM pat_2017_1_13;
INSERT INTO production
SELECT *
FROM pat_2017_1_14;
INSERT INTO production
SELECT *
FROM pat_2017_1_15;
INSERT INTO production
SELECT *
FROM pat_2017_1_16;
INSERT INTO production
SELECT *
FROM pat_2017_1_17;
INSERT INTO production
SELECT *
FROM pat_2017_1_18;
INSERT INTO production
SELECT *
FROM pat_2017_1_19;
INSERT INTO production
SELECT *
FROM pat_2017_1_20;
INSERT INTO production
SELECT *
FROM pat_2017_1_21;
INSERT INTO production
SELECT *
FROM pat_2017_1_22;
INSERT INTO production
SELECT *
FROM pat_2017_1_23;
INSERT INTO production
SELECT *
FROM pat_2017_1_24;
INSERT INTO production
SELECT *
FROM pat_2017_1_25;
INSERT INTO production
SELECT *
FROM pat_2017_1_26;
INSERT INTO production
SELECT *
FROM pat_2017_1_27;
INSERT INTO production
SELECT *
FROM pat_2017_1_28;
INSERT INTO production
SELECT *
FROM pat_2017_1_29;
INSERT INTO production
SELECT *
FROM pat_2017_1_30;
This code imports all data from raw table into production table.
f. Correct data, particularly with date and time
DROP TABLE IF EXISTS productioncorrected;

create table productioncorrected select * from production;


UPDATE productioncorrected SET productioncorrected.`to` = replace(productioncorrected.`to`,'1900-01-01','24:00:00.000');
UPDATE productioncorrected SET productioncorrected.`from` = replace(productioncorrected.`from`,'1900-01-02 ','');
UPDATE productioncorrected SET productioncorrected.`from` = replace(productioncorrected.`from`,'1900-01-02','00:00:00.000');

#####
UPDATE productioncorrected SET productioncorrected.`from` = replace(productioncorrected.`from`,'1:00AM','01:00:00.000');
UPDATE productioncorrected SET productioncorrected.`from` = replace(productioncorrected.`from`,'2:00AM','02:00:00.000');
UPDATE productioncorrected SET productioncorrected.`from` = replace(productioncorrected.`from`,'3:00AM','03:00:00.000');
UPDATE productioncorrected SET productioncorrected.`from` = replace(productioncorrected.`from`,'4:00AM','04:00:00.000');
UPDATE productioncorrected SET productioncorrected.`from` = replace(productioncorrected.`from`,'5:00AM','05:00:00.000');
UPDATE productioncorrected SET productioncorrected.`from` = replace(productioncorrected.`from`,'6:00AM','06:00:00.000');
UPDATE productioncorrected SET productioncorrected.`from` = replace(productioncorrected.`from`,'7:00AM','07:00:00.000');
UPDATE productioncorrected SET productioncorrected.`from` = replace(productioncorrected.`from`,'8:00AM','08:00:00.000');
UPDATE productioncorrected SET productioncorrected.`from` = replace(productioncorrected.`from`,'9:00AM','09:00:00.000');
UPDATE productioncorrected SET productioncorrected.`from` = replace(productioncorrected.`from`,'10:00AM','10:00:00.000');
UPDATE productioncorrected SET productioncorrected.`from` = replace(productioncorrected.`from`,'11:00AM','11:00:00.000');
UPDATE productioncorrected SET productioncorrected.`from` = replace(productioncorrected.`from`,'12:00PM','12:00:00.000');
UPDATE productioncorrected SET productioncorrected.`from` = replace(productioncorrected.`from`,'01:00PM','13:00:00.000');
UPDATE productioncorrected SET productioncorrected.`from` = replace(productioncorrected.`from`,'02:00PM','14:00:00.000');
UPDATE productioncorrected SET productioncorrected.`from` = replace(productioncorrected.`from`,'03:00PM','15:00:00.000');
UPDATE productioncorrected SET productioncorrected.`from` = replace(productioncorrected.`from`,'04:00PM','16:00:00.000');
UPDATE productioncorrected SET productioncorrected.`from` = replace(productioncorrected.`from`,'05:00PM','17:00:00.000');
UPDATE productioncorrected SET productioncorrected.`from` = replace(productioncorrected.`from`,'06:00PM','18:00:00.000');
UPDATE productioncorrected SET productioncorrected.`from` = replace(productioncorrected.`from`,'07:00PM','19:00:00.000');
UPDATE productioncorrected SET productioncorrected.`from` = replace(productioncorrected.`from`,'08:00PM','20:00:00.000');
UPDATE productioncorrected SET productioncorrected.`from` = replace(productioncorrected.`from`,'09:00PM','21:00:00.000');
UPDATE productioncorrected SET productioncorrected.`from` = replace(productioncorrected.`from`,'10:00PM','22:00:00.000');
UPDATE productioncorrected SET productioncorrected.`from` = replace(productioncorrected.`from`,'11:00PM','23:00:00.000');
UPDATE productioncorrected SET productioncorrected.`from` = replace(productioncorrected.`from`,'12:00AM','00:00:00.000');


#####
UPDATE productioncorrected SET productioncorrected.`to` = replace(productioncorrected.`to`,'1:00AM','01:00:00.000');
UPDATE productioncorrected SET productioncorrected.`to` = replace(productioncorrected.`to`,'2:00AM','02:00:00.000');
UPDATE productioncorrected SET productioncorrected.`to` = replace(productioncorrected.`to`,'3:00AM','03:00:00.000');
UPDATE productioncorrected SET productioncorrected.`to` = replace(productioncorrected.`to`,'4:00AM','04:00:00.000');
UPDATE productioncorrected SET productioncorrected.`to` = replace(productioncorrected.`to`,'5:00AM','05:00:00.000');
UPDATE productioncorrected SET productioncorrected.`to` = replace(productioncorrected.`to`,'6:00AM','06:00:00.000');
UPDATE productioncorrected SET productioncorrected.`to` = replace(productioncorrected.`to`,'7:00AM','07:00:00.000');
UPDATE productioncorrected SET productioncorrected.`to` = replace(productioncorrected.`to`,'8:00AM','08:00:00.000');
UPDATE productioncorrected SET productioncorrected.`to` = replace(productioncorrected.`to`,'9:00AM','09:00:00.000');
UPDATE productioncorrected SET productioncorrected.`to` = replace(productioncorrected.`to`,'10:00AM','10:00:00.000');
UPDATE productioncorrected SET productioncorrected.`to` = replace(productioncorrected.`to`,'11:00AM','11:00:00.000');
UPDATE productioncorrected SET productioncorrected.`to` = replace(productioncorrected.`to`,'12:00PM','12:00:00.000');
UPDATE productioncorrected SET productioncorrected.`to` = replace(productioncorrected.`to`,'01:00PM','13:00:00.000');
UPDATE productioncorrected SET productioncorrected.`to` = replace(productioncorrected.`to`,'02:00PM','14:00:00.000');
UPDATE productioncorrected SET productioncorrected.`to` = replace(productioncorrected.`to`,'03:00PM','15:00:00.000');
UPDATE productioncorrected SET productioncorrected.`to` = replace(productioncorrected.`to`,'04:00PM','16:00:00.000');
UPDATE productioncorrected SET productioncorrected.`to` = replace(productioncorrected.`to`,'05:00PM','17:00:00.000');
UPDATE productioncorrected SET productioncorrected.`to` = replace(productioncorrected.`to`,'06:00PM','18:00:00.000');
UPDATE productioncorrected SET productioncorrected.`to` = replace(productioncorrected.`to`,'07:00PM','19:00:00.000');
UPDATE productioncorrected SET productioncorrected.`to` = replace(productioncorrected.`to`,'08:00PM','20:00:00.000');
UPDATE productioncorrected SET productioncorrected.`to` = replace(productioncorrected.`to`,'09:00PM','21:00:00.000');
UPDATE productioncorrected SET productioncorrected.`to` = replace(productioncorrected.`to`,'10:00PM','22:00:00.000');
UPDATE productioncorrected SET productioncorrected.`to` = replace(productioncorrected.`to`,'11:00PM','23:00:00.000');
UPDATE productioncorrected SET productioncorrected.`to` = replace(productioncorrected.`to`,'12:00AM','24:00:00.000');

UPDATE productioncorrected SET productioncorrected.`to` = replace(productioncorrected.`to`,'    101:00:00.000','11:00:00.000');

UPDATE productioncorrected SET productioncorrected.`to` = replace(productioncorrected.`to`,'    102:00:00.000','24:00:00.000');

UPDATE productioncorrected SET productioncorrected.`from` = replace(productioncorrected.`from`,'    101:00:00.000','11:00:00.000');

UPDATE productioncorrected SET productioncorrected.`from` = replace(productioncorrected.`from`,'    102:00:00.000','24:00:00.000');


UPDATE productioncorrected SET productioncorrected.`to` = "24:00:00.000"
WHERE productioncorrected.`from`= "23:00:00.000";


UPDATE productioncorrected SET productioncorrected.`to` = "11:00:00.000"
WHERE productioncorrected.`from`= "10:00:00.000";

UPDATE productioncorrected SET productioncorrected.`from` = "11:00:00.000"
WHERE productioncorrected.`to`= "12:00:00.000";

UPDATE productioncorrected SET productioncorrected.`from` = "24:00:00.000"
WHERE productioncorrected.`to`= "01:00:00.000";
This code is used to correct
- time data
- missing data
- outliner
g. Create analysis table
DROP TABLE IF EXISTS analysis;

CREATE TABLE analysis
Select *

from
productioncorrected
where productioncorrected.total_pro_hour >0
and
productioncorrected.total_power_hour>0
and
productioncorrected.total_power_hour NOT LIKE "-"
;

ALTER TABLE analysis MODIFY COLUMN total_power_hour DOUBLE;

ALTER TABLE analysis MODIFY COLUMN total_pro_hour DOUBLE;

ALTER TABLE analysis MODIFY COLUMN ratio DOUBLE;
Analysis table is basically the same with production but with some correction
h. Create Analysis Date table
DROP TABLE IF EXISTS analysisdate;

CREATE TABLE analysisdate
Select
*
from
analysis
GROUP BY analysis.date;

ALTER TABLE analysisdate
ADD id int NOT NULL AUTO_INCREMENT PRIMARY KEY;
This SQL code will create Analysis Date table that basically summary hourly data into daily data.
WHAO, after going through each of the above Query, my figures are tired already. You can further enhance SQL code to make the entire process faster, but still it is much slower than using below R code.
Combining worksheets using R
Below R codes are extracted from Github source
This code is used to combine multiple excel worksheets into one dataframe. Particularly useful when combining multiple worksheets of production data with each worksheet is a date of a month, and in each worksheet, data is saved in hourly basis.
the first method, using XlConnect.
# this method has a limitation that XlConnect doesnt work well with excel files with dynamic links. When importing into R, it gives NA values.
# to make sure that importing is perfect. It is advisable to disable all dynamic links in excel file by going to Data
library(XLConnect)
# load data file (excel files ended with cls, xlsc, or xlsm)
datafile <- loadWorkbook("data1.xlsx") # This is a static worksheet, without any dynamic links
# obtain sheet names
worksheets <- getSheets(datafile)
names(worksheets) <- worksheets
# dataframe
worksheets_list <- lapply(worksheets, function(.sheet){readWorksheet(object=datafile, .sheet)})
# limit worksheet_list to sheets with at least 1 dimension
worksheets_list2 <- worksheets_list[sapply(worksheets_list, function(x) dim(x)[1]) > 0]
# code to read in each excel worksheet as individual dataframes
for (i in 2:length(worksheets_list2)){assign(paste0("df", i), as.data.frame(worksheets_list2[i]))}
# define function to clean data in each data frame (updated based on your data). You must define here carefully otherwise it will not work well with some certain type of data. The fastest way is only drop out missing values. Other value can be dealed with using query in MySQL
cleaner <- function(df){
# drop rows with missing values
df <- df[rowSums(is.na(df)) == 0,]
# remove serial comma from all variables
# df[,-1] <- as.numeric(gsub(",", "", as.matrix(df[,-1])))
# create numeric version of year variable for graphing
# df$Year <- as.numeric(substr(df$year, 1, 4))
# return cleaned df
return(df)
}
# clean sheets and create one data frame
data1 <- do.call(rbind,lapply(names(worksheets_list2), function(x) cleaner(worksheets_list2[[x]])))
cat("Print out the data 1 frame \n")
print(data1)
# Method is with readxl package. This is superior than the former one as readxl can handle excel files with dynamic links. This means it will retain values and ignore the links.
# ----------------
library(readxl)
read_excel_allsheets <- function(filename, tibble = FALSE) {
  # I prefer straight data.frames
  # but if you like tidyverse tibbles (the default with read_excel)
  # then just pass tibble = TRUE
  sheets <- readxl::excel_sheets(filename)
  x <- lapply(sheets, function(X) readxl::read_excel(filename, sheet = X))
  if(!tibble) x <- lapply(x, as.data.frame)
  names(x) <- sheets
  x
}

#start to read and write data into csv file
worksheets <- read_excel_allsheets("data1.xlsx")
source("cleaning.R")
filedata <- do.call(rbind,lapply(names(worksheets), function(x) cleaner(worksheets[[x]])))
write.table(filedata, "myDF.csv", sep = ",", col.names = !file.exists("myDF.csv"), row.names=FALSE, append = T)

worksheets <- read_excel_allsheets("data2.xlsm")
source("cleaning.R")
filedata <- do.call(rbind,lapply(names(worksheets), function(x) cleaner(worksheets[[x]])))
write.table(filedata, "myDF.csv", sep = ",", col.names = !file.exists("myDF.csv"), row.names=FALSE, append = T)
#end
#https://medium.com/@niharika.goel/merge-multiple-csv-excel-files-in-a-folder-using-r-e385d962a90a
Combining multiple excel files using R
I found the code from Niharika suits the purpose of this exercise. Kindly refer to her github site for original code.
https://github.com/NiharikaGoel12/R-Playground
Her readme file states This repository contains basic codes for R, which might be useful in day to day work, especially doing data analysis on large datasets in Excel or CSV.
#Merge multiple Excel/CSV files in a folder
Consider a case when you have multiple xlsx/csv files in a folder & you to merge them into one single file. Here, I have used lapply() which returns a list of the same length as i. And grepl() will check exact match between merge_file_name & existing file ‘i’. In this case, if the two files are same, we will ignore already created “merge file”.
rbind() will combine data frame by rows and merge all the files.
a. Combining CSV files
path <- "sample-data/merge-files/csv"
merge_file_name <- "sample-data/merge-files/merged_file.csv"

filenames <- list.files(path= path, full.names=TRUE)

All <- lapply(filenames,function(filename){
    print(paste("Merging",filename,sep = " "))
    read.csv(filename)
})
df <- do.call(rbind.data.frame, All)
write.csv(df,merge_file_name)
b. Combining excel files
library(openxlsx)

path <- "sample-data/merge-files/xlsx"
merge_file_name <- "sample-data/merge-files/merged_file.xlsx"

filenames_list <- list.files(path= path, full.names=TRUE)

All <- lapply(filenames_list,function(filename){
    print(paste("Merging",filename,sep = " "))
    read.xlsx(filename)
})

df <- do.call(rbind.data.frame, All)
write.xlsx(df,merge_file_name)
c. Combining the example data
We can use the code in step a and b of this section. However, there is one draw back that we need to save our data first into csv or excel file. This is also a bit of time consuming. To avoid this, we can just simply write directly data into csv file as presented in the last part of section 4.
# ----------------
library(readxl)
read_excel_allsheets <- function(filename, tibble = FALSE) {
  # I prefer straight data.frames
  # but if you like tidyverse tibbles (the default with read_excel)
  # then just pass tibble = TRUE
  sheets <- readxl::excel_sheets(filename)
  x <- lapply(sheets, function(X) readxl::read_excel(filename, sheet = X))
  if(!tibble) x <- lapply(x, as.data.frame)
  names(x) <- sheets
  x
}
#start to read and write data into csv file
worksheets <- read_excel_allsheets("data1.xlsx")
source("cleaning.R")
filedata <- do.call(rbind,lapply(names(worksheets), function(x) cleaner(worksheets[[x]])))
write.table(filedata, "myDF.csv", sep = ",", col.names = !file.exists("myDF.csv"), row.names=FALSE, append = T)


worksheets <- read_excel_allsheets("data2.xlsm")
source("cleaning.R")
filedata <- do.call(rbind,lapply(names(worksheets), function(x) cleaner(worksheets[[x]])))
write.table(filedata, "myDF.csv", sep = ",", col.names = !file.exists("myDF.csv"), row.names=FALSE, append = T)

#end
The above code read 2 data files data1.xlsx and data2.xlsm, combining all worksheets of these two files and then write the data frame to a CSV file named myDF.csv. If we have more than 2 files to read and combine, we can just copy the code and paste it under and remember to change the source data file. We can also automate this process by making a loop, which will be presented in other post.
Once we have the combined CSV file, we can use NaviCAT to import this file to MySQL for further enhancement as presented in section 3. In the end, we can summary the production and energy consumption data in day or week that will be useful for visualization, correlation, and regression analysis.
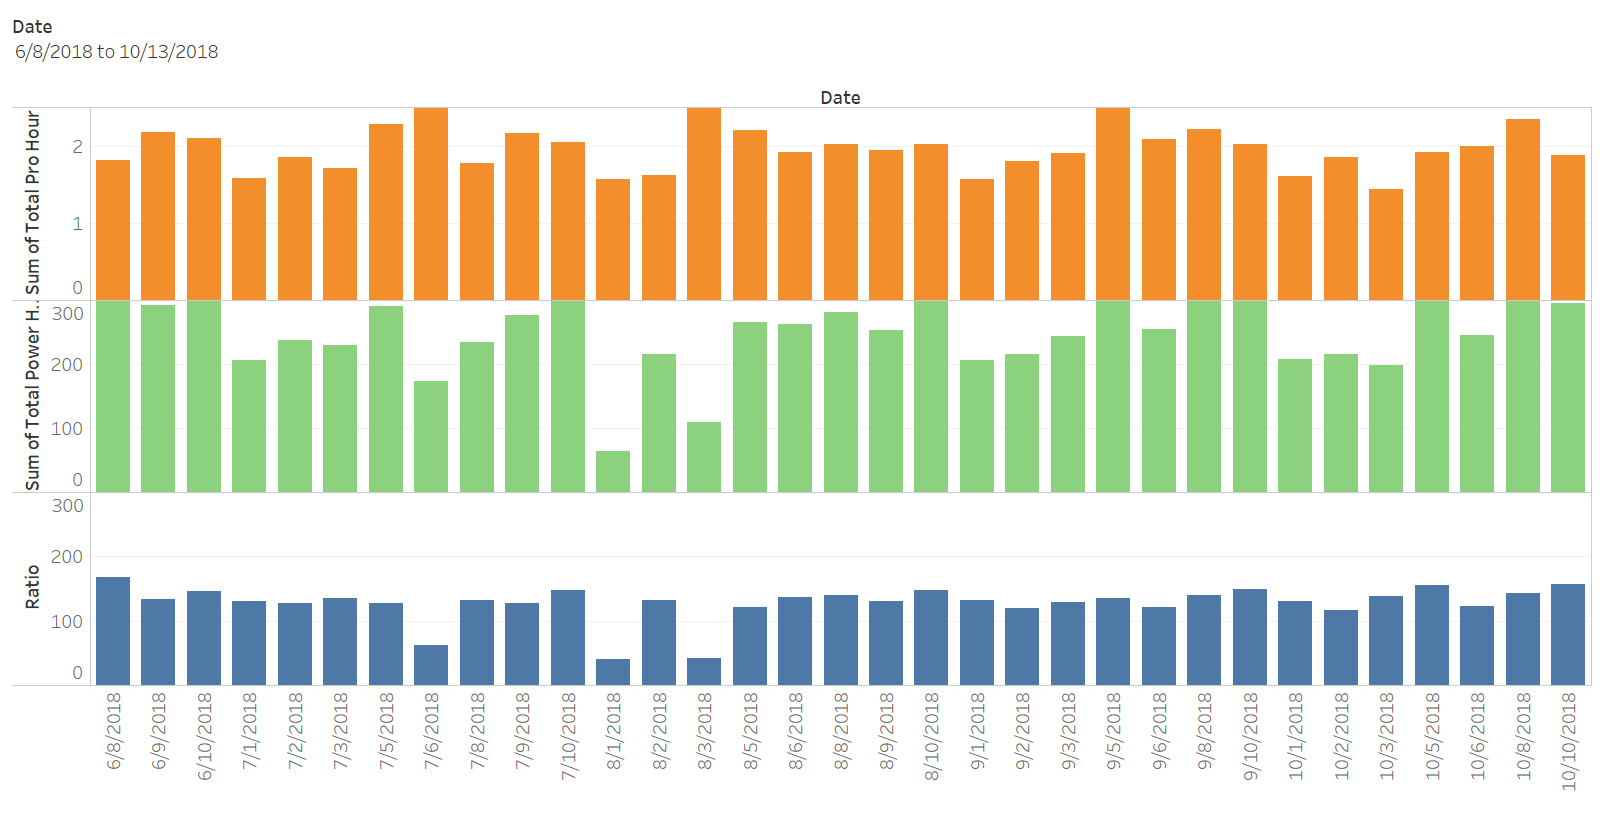
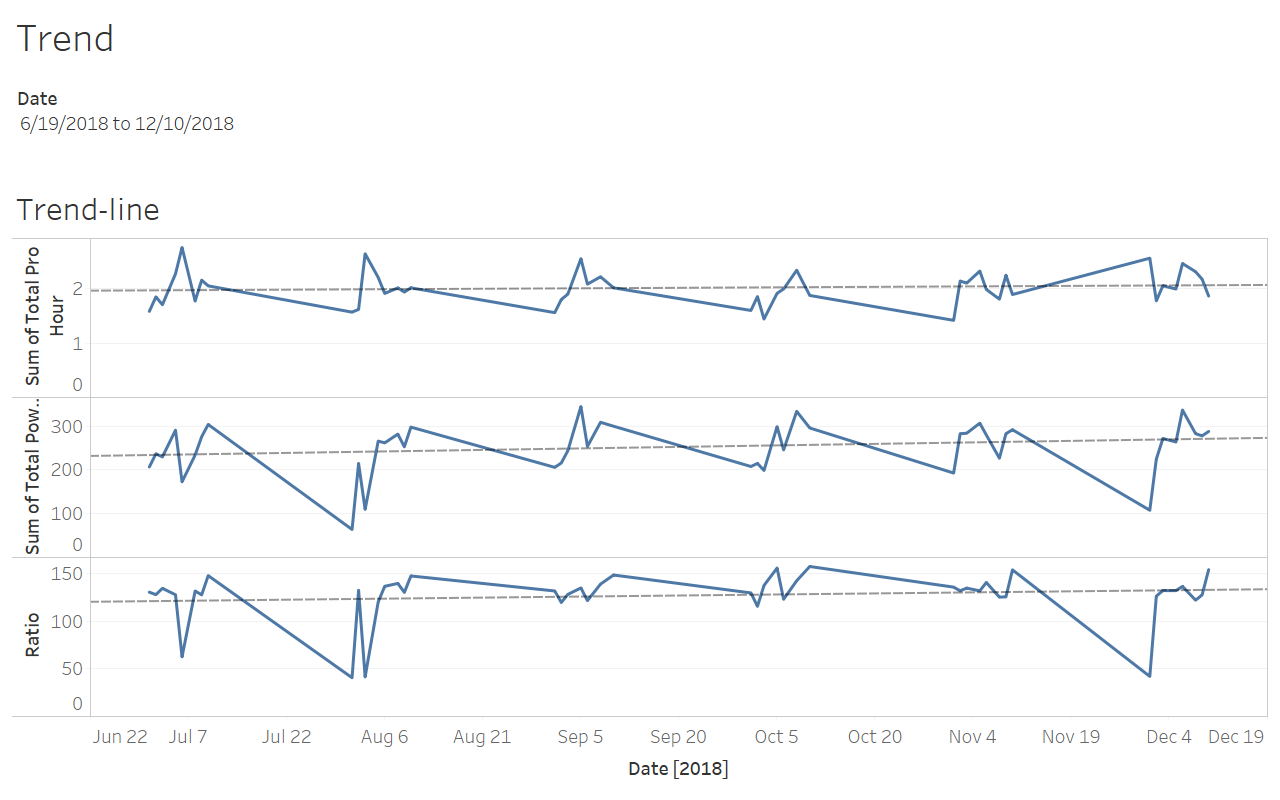
Visualization
Tableu
R
library(DBI)
library(RODBC)
library(RMySQL)
library(xts)
library(ggplot2)
library(hydroTSM) #call the hydrology package for time series analysis
#this code is used for energy audit of the plant based on production and power consumption
dataproduction = dbConnect(MySQL(), user='root', password='', dbname='exampledata', host='localhost')
#exampledata is the database stored in your MySQL server
dbListTables(dataproduction)
dbListFields(dataproduction, 'analysisdate')
rs = dbSendQuery(dataproduction, "select * from analysisdate")
rs=dbFetch(rs, n = -1)
data=c(rs[1],rs[4],rs[5],rs[6])
a=as.Date(data$date,"%Y-%m-%d")
production=data$total_pro_hour
power=data$total_power_hour
ratio=data$ratio
data=data.frame(a,production,power,ratio)
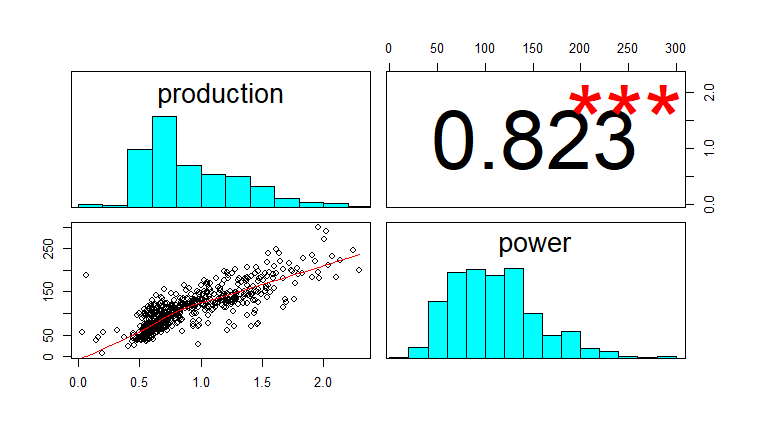
#Correlation analysis
hydropairs(data[,2:3])
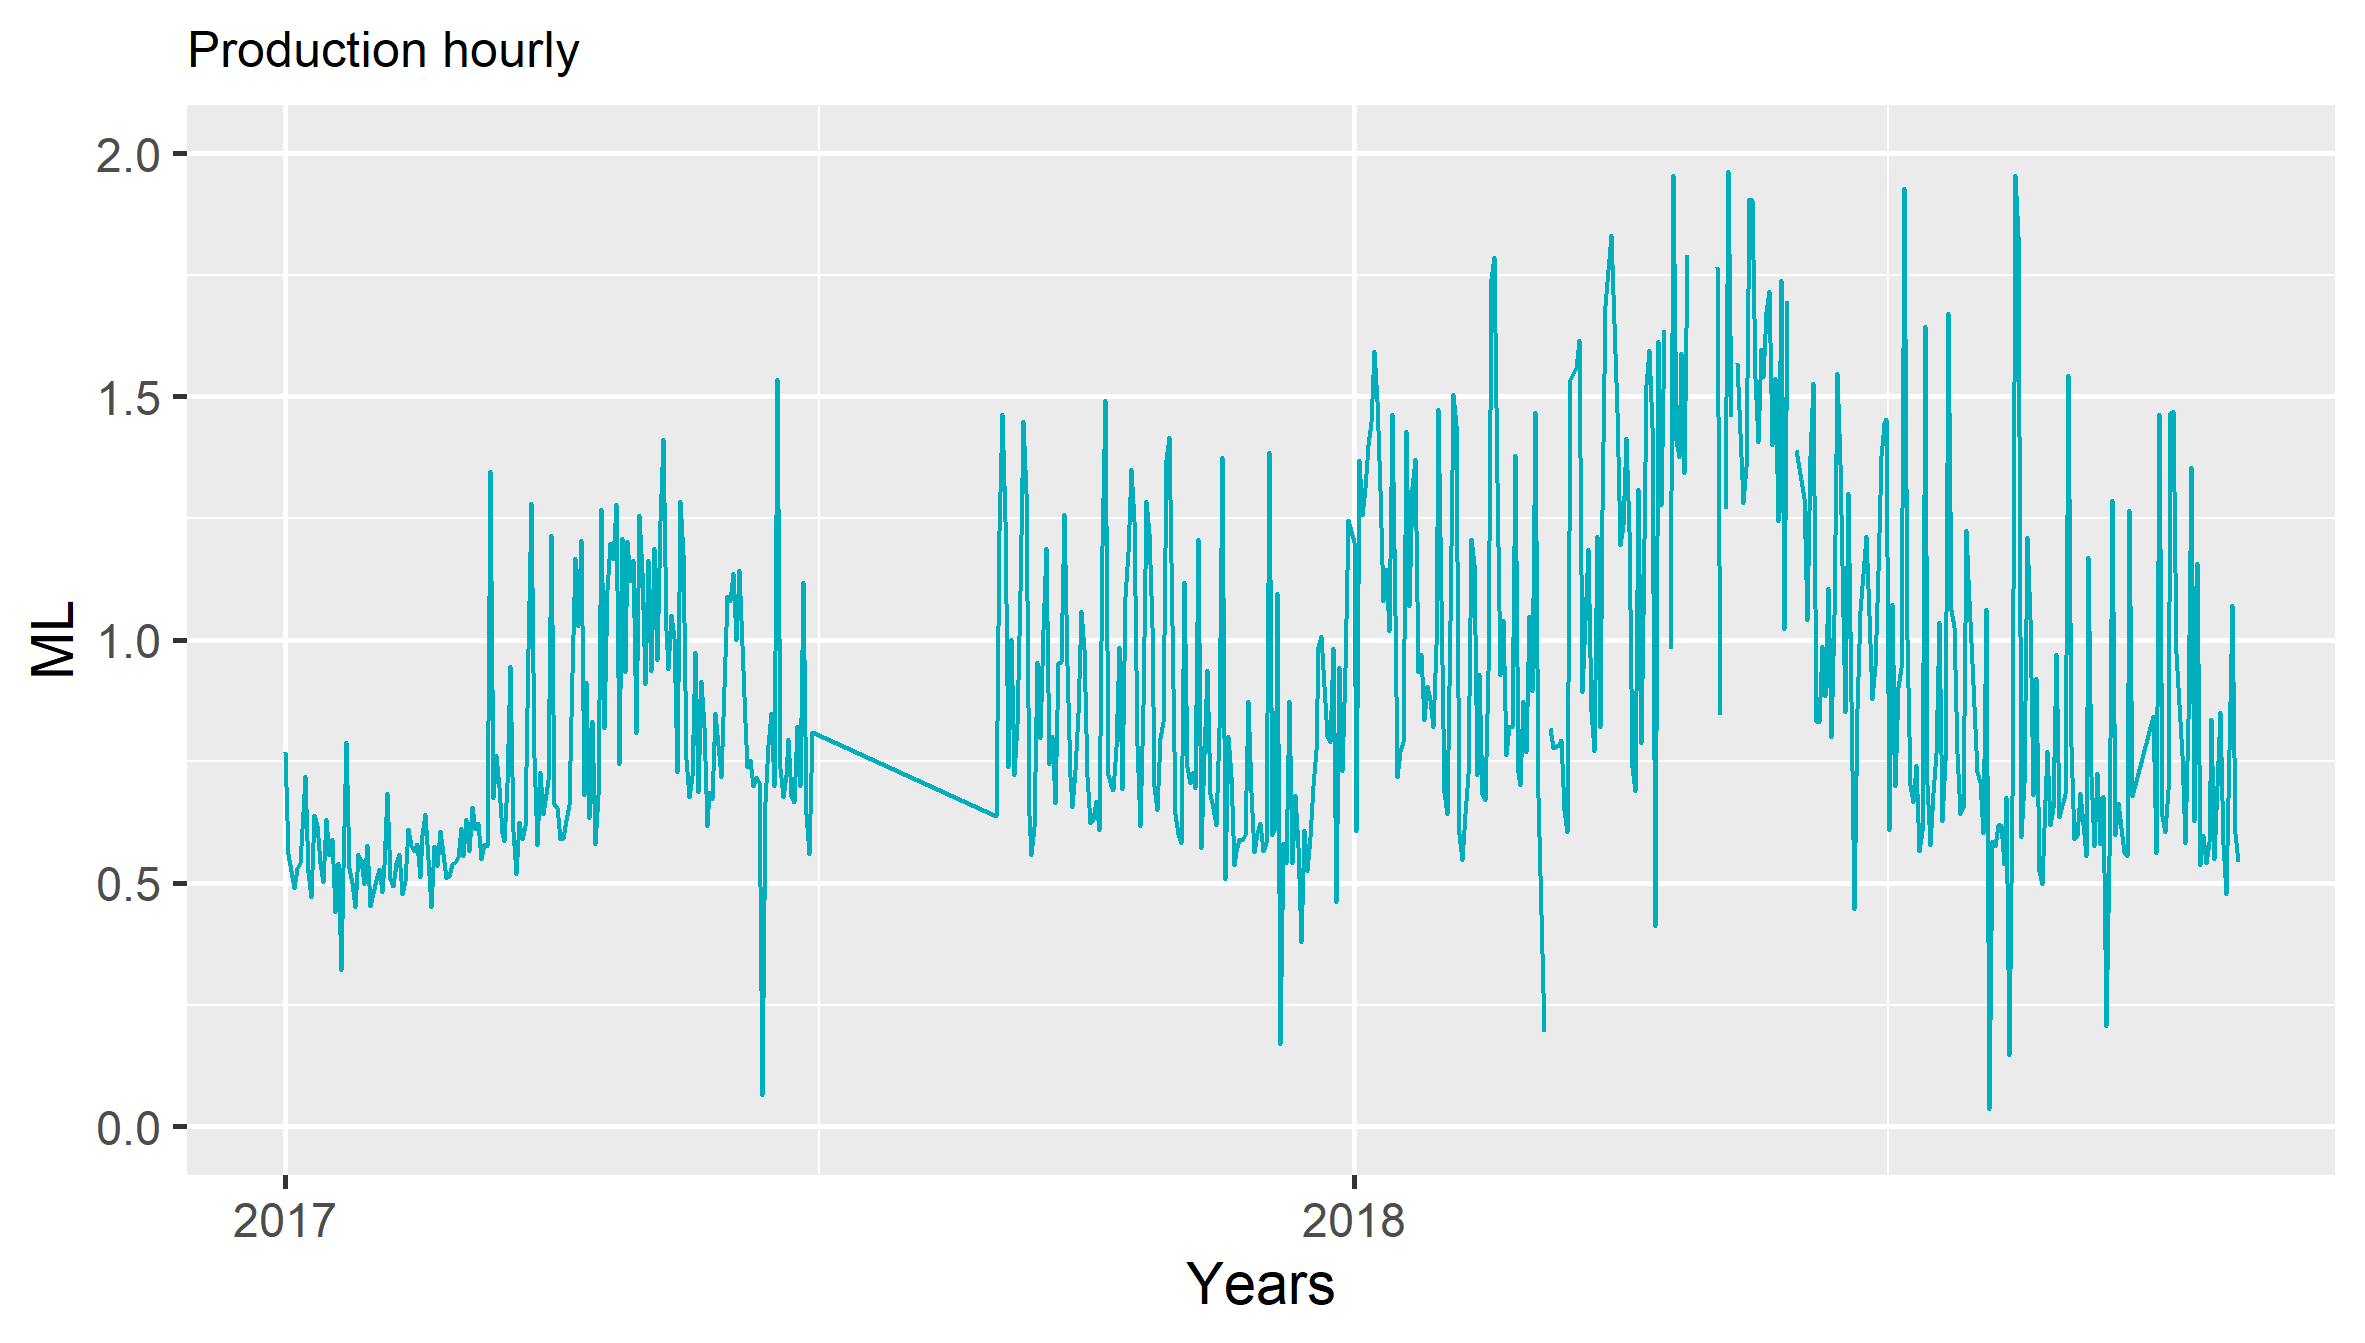
#Plot production data
plot.new()
p=ggplot(data=data,aes(a, production))+ geom_line(color = "#00AFBB") + theme(axis.text.x = element_text(angle = 60,hjust=1))+theme_gray(base_size = 14)+ theme(plot.title = element_text(size=12))
p
min <- as.Date("2017-01-01")
max <- as.Date("2018-10-30")
#p + scale_x_date(limits = c(min, max))
pp=p+scale_x_date(date_labels = "%Y",date_breaks="year",limits = c(min, max))+labs(title = "Production hourly",x="Years",y="ML")+scale_y_continuous(limits=c(0,2))#+ stat_smooth(method="lm")
ggsave("ch05_fig_energy_production.png", plot = pp)
print(pp)
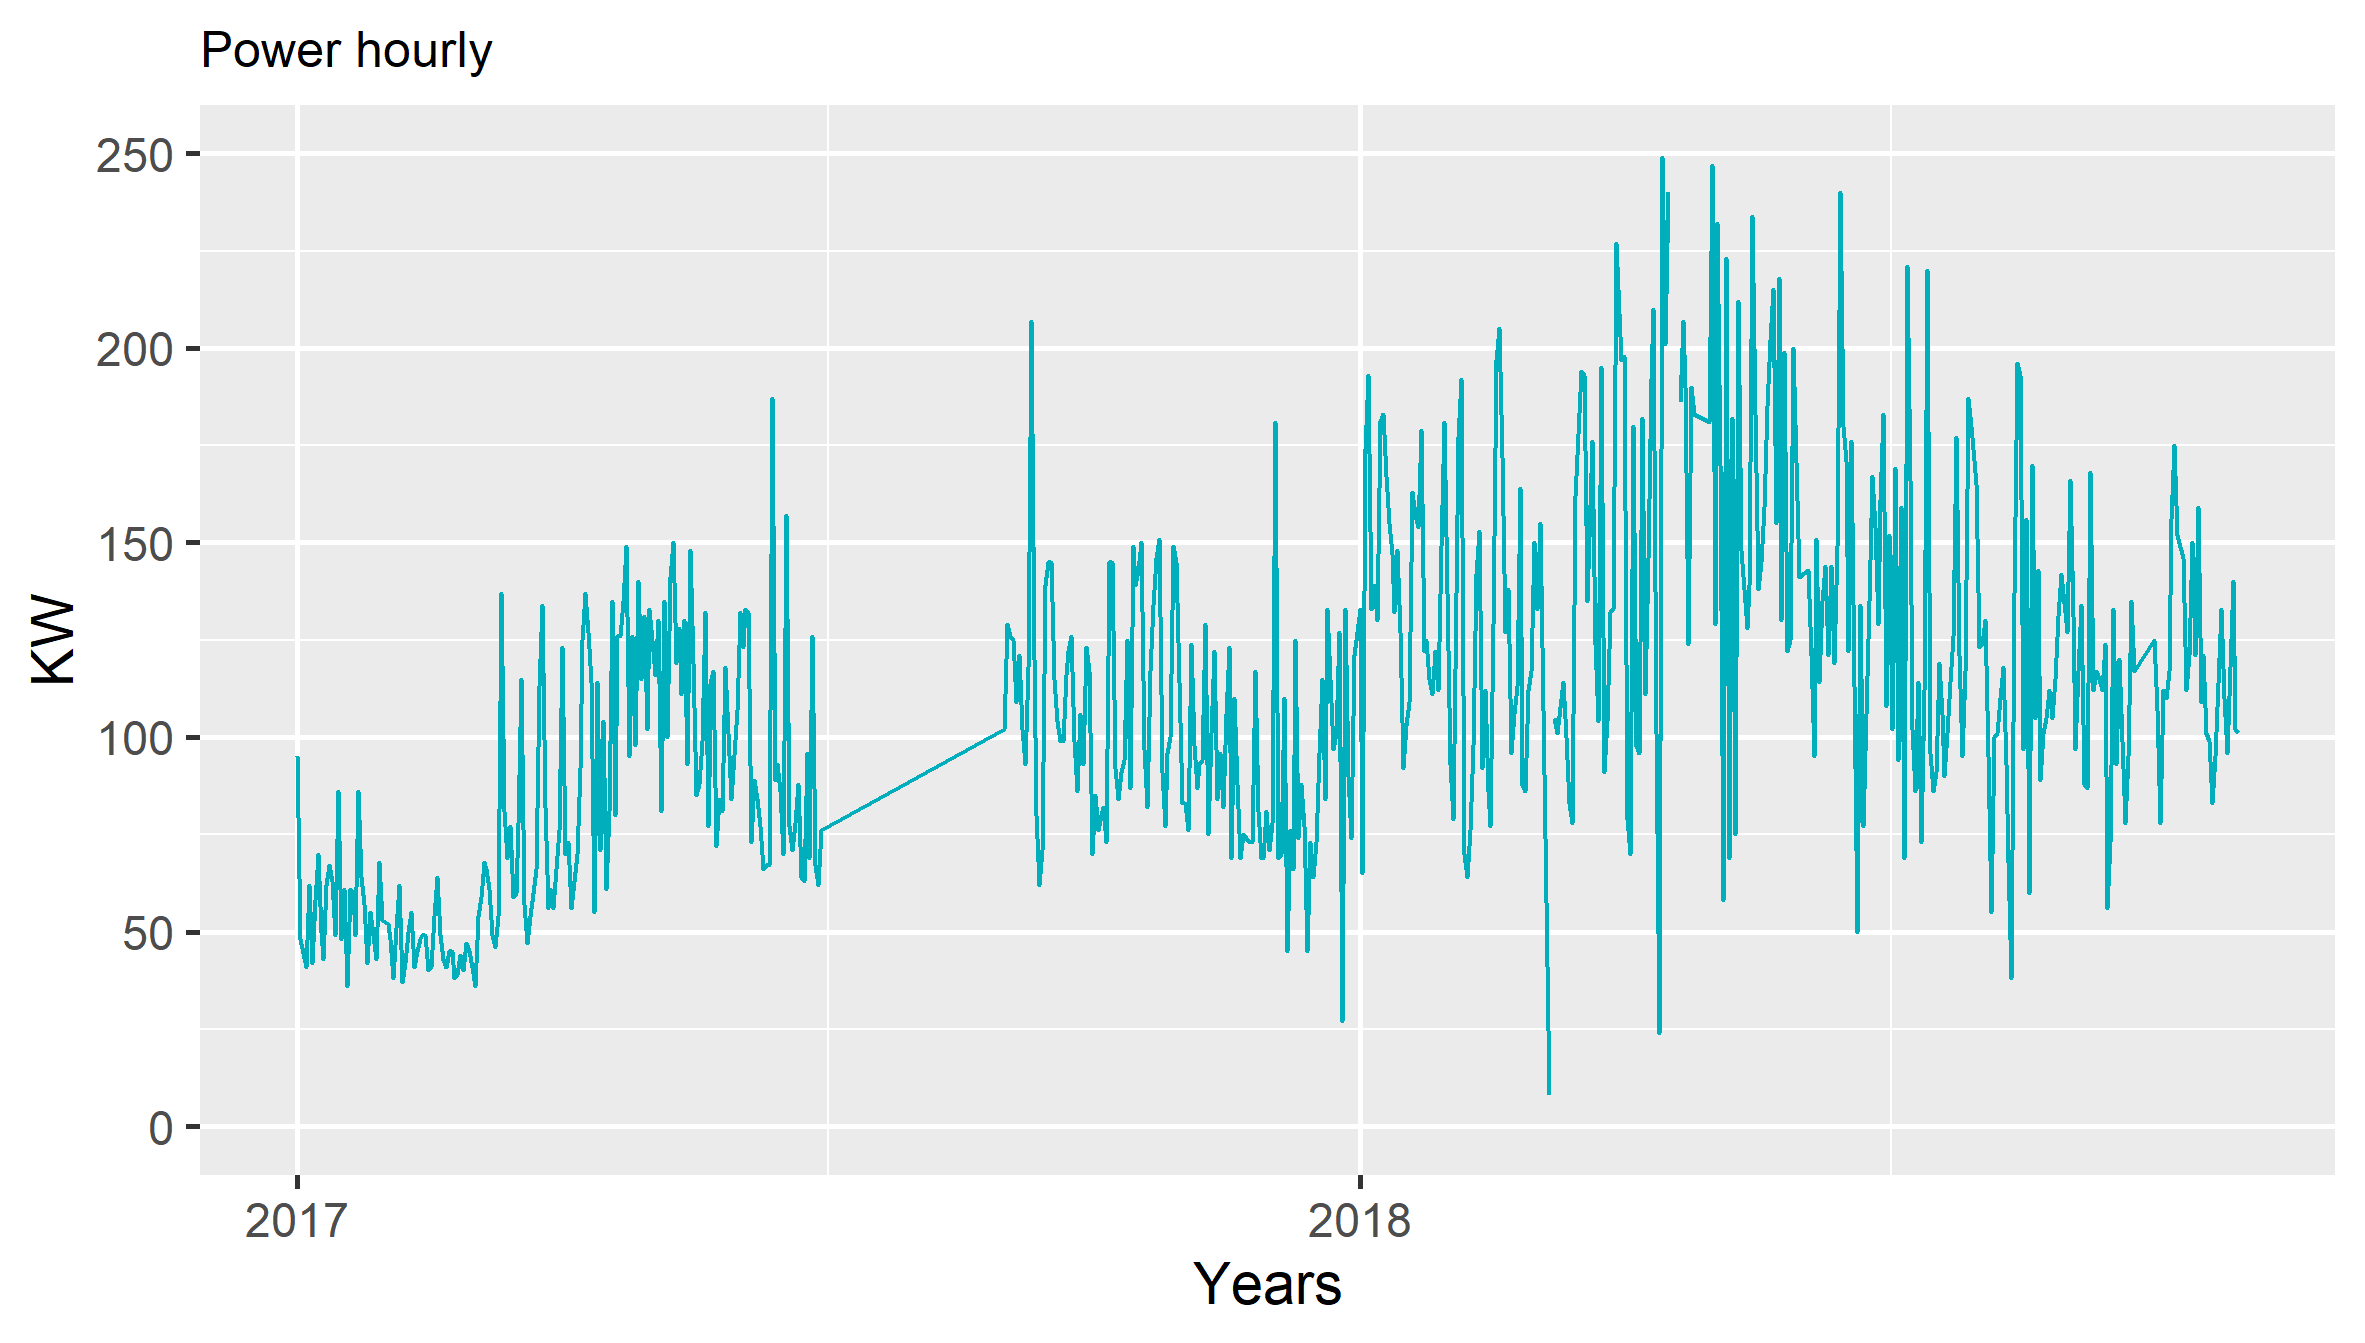
#Plot power consumption data
plot.new()
q=ggplot(data=data,aes(a, power))+ geom_line(color = "#00AFBB") + theme(axis.text.x = element_text(angle = 60,hjust=1))+theme_gray(base_size = 14)+ theme(plot.title = element_text(size=12))
#q
min <- as.Date("2017-01-01")
max <- as.Date("2018-10-30")
#p + scale_x_date(limits = c(min, max))
qq=q+scale_x_date(date_labels = "%Y",date_breaks="year",limits = c(min, max))+labs(title = "Power hourly",x="Years",y="KW")+scale_y_continuous(limits=c(0,250))#+ stat_smooth(method="lm")
ggsave("ch05_fig_energy_power.png", plot = qq)
print(qq)
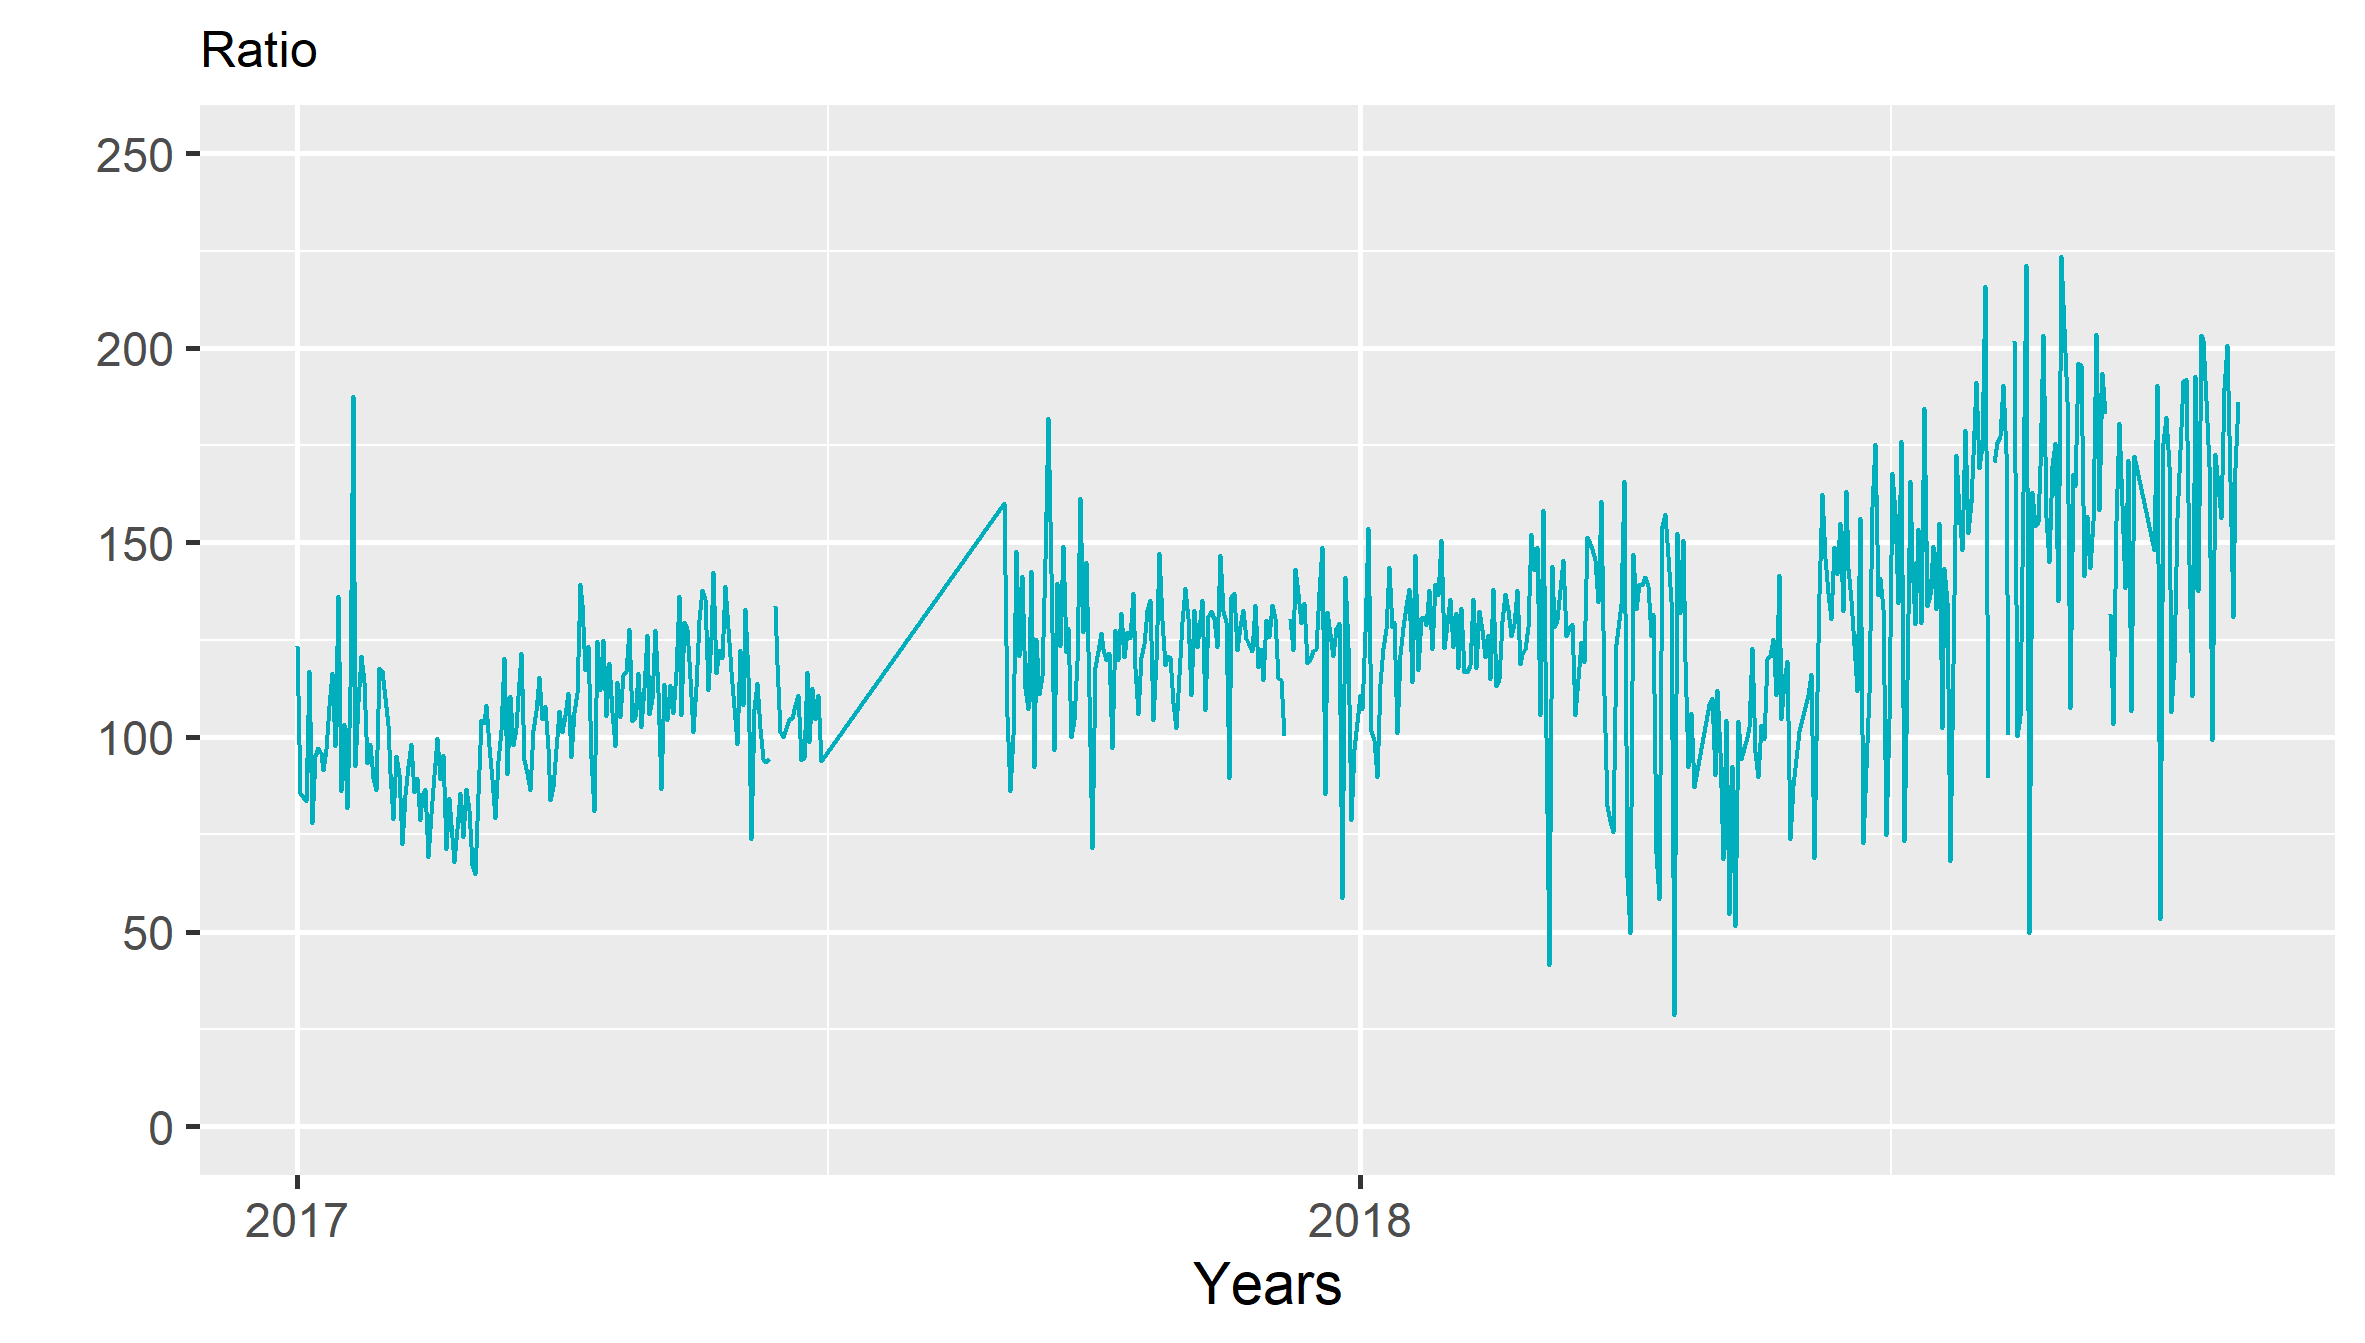
#plot ratio
plot.new()
w=ggplot(data=data,aes(a, ratio))+ geom_line(color = "#00AFBB") + theme(axis.text.x = element_text(angle = 60,hjust=1))+theme_gray(base_size = 14)+ theme(plot.title = element_text(size=12))
#w
min <- as.Date("2017-01-01")
max <- as.Date("2018-10-30")
#p + scale_x_date(limits = c(min, max))
ww=w+scale_x_date(date_labels = "%Y",date_breaks="year",limits = c(min, max))+labs(title = "Ratio",x="Years",y="")+scale_y_continuous(limits=c(0,250))#+ stat_smooth(method="lm")
ggsave("ch05_fig_energy_ratio.png", plot = ww)
print(ww)
dbDisconnect(dataproduction)
Nam Le
Risk and Asset Management Specialist for Buildings and Engineering Systems
My research interests include Operation Research and Applied Statistics for Asset Management of Buildings and Engineering Systems.